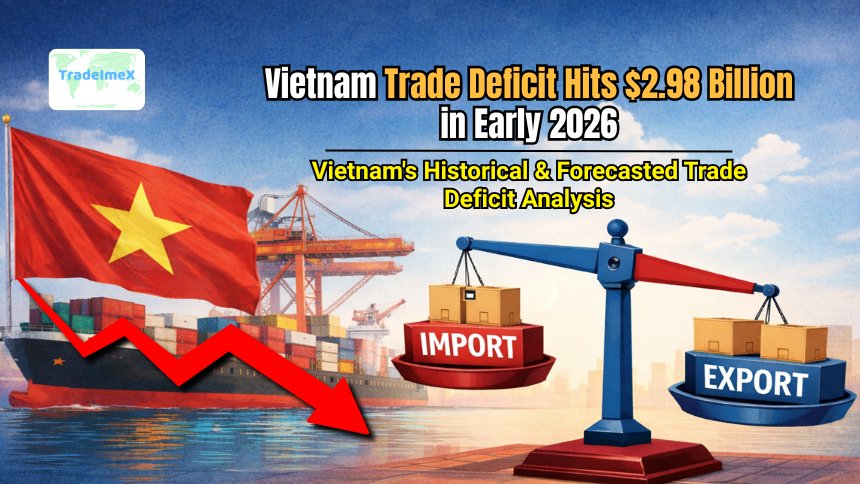
Vietnam Trade Deficit Hits $2.98 Billion in Early 2026: Vietnam's Historical & Forecasted Trade Deficit Analysis
Vietnam's trade deficit reached $2.98 billion in early 2026. Explore Vietnam’s historical trade deficit trends, future forecasts, & key factors shaping the country’s trade balance.
Vietnam has spent much of the past decade positioning itself as one of Asia’s most export-driven economies. From electronics and textiles to agricultural commodities, the country has built a reputation as a manufacturing hub integrated deeply into global supply chains. Yet the start of 2026 delivered a reminder that trade dynamics can shift quickly. In the first two months of 2026, Vietnam recorded a trade deficit of $2.98 billion, despite strong trade growth and rising exports, according to the latest Vietnam export data & Vietnam import data.
While the deficit may appear modest relative to Vietnam’s total trade volume, it carries important signals about structural trade patterns, supply chain dependencies, and the trajectory of Vietnam’s economic expansion. This article provides a data-driven analysis of Vietnam’s early-2026 trade deficit, reviews the historical evolution of Vietnam’s trade balance, and explores future forecasts for the country’s external trade position.
Vietnam’s $2.98 Billion Trade Deficit in Early 2026

Vietnam’s trade deficit of $2.98 billion in January–February 2026 occurred during a period of rapid trade growth and rising imports.
Key trade statistics (Jan–Feb 2026)
|
Indicator |
Value |
|
Total trade turnover |
$155.7 billion |
|
Exports |
$76.36 billion |
|
Imports |
$79.34 billion |
|
Trade balance |
–$2.98 billion deficit |
These figures represent 22.2% growth in overall trade compared with the same period in 2025, highlighting Vietnam’s strong integration with global markets. However, imports expanded faster than exports during the period, leading to the trade imbalance.
Sector contribution to the deficit
The trade deficit is unevenly distributed across Vietnam’s economic sectors.
|
Sector |
Trade Balance |
|
Domestic economic sector |
–$6.5 billion deficit |
|
Foreign-invested sector |
+$3.52 billion surplus |
Foreign-invested companies such as multinational electronics manufacturers continue to dominate Vietnam’s export performance, accounting for around 79% of exports. In contrast, the domestic sector remains more import-dependent, particularly for raw materials and intermediate goods used in manufacturing, as per the Vietnam customs data.
Composition of Vietnam’s Trade in Early 2026
Understanding the structure of exports and imports helps explain the temporary trade deficit.
Export composition
Vietnam’s export basket is heavily concentrated in manufactured and processed goods.
Key export categories include:
-
Electronics and semiconductors
-
Smartphones and computers
-
Textiles and garments
-
Footwear
-
Furniture
-
Agricultural products such as coffee and rice
In early 2026, processed industrial goods accounted for nearly 89.8% of exports, reflecting Vietnam’s strong role in global manufacturing supply chains, as per the Vietnam customs export data by HS code.
Import composition
Imports are dominated by production inputs rather than consumer goods.
Key import categories:
-
Machinery and manufacturing equipment
-
Electronic components
-
Petroleum and energy products
-
Industrial raw materials
-
Agricultural feedstocks
Production materials represented 94.1% of imports, indicating that Vietnam imports heavily to sustain export manufacturing, as per the Vietnam customs import data by HS code. This structure explains why import growth can temporarily exceed export growth during periods of industrial expansion.
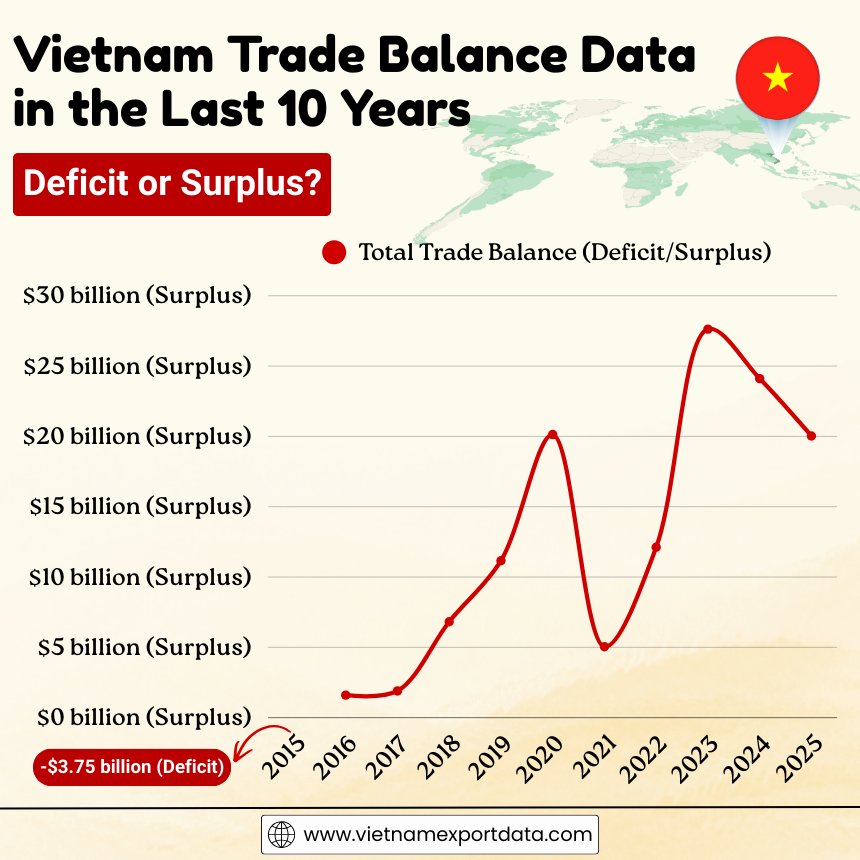
Vietnam Trade Balance Data in the Last 10 Years: Deficit or Surplus?
|
Year of Trade |
Total Trade Balance (Deficit/Surplus) |
|
2015 |
-$3.75 billion (Deficit) |
|
2016 |
$1.60 billion (Surplus) |
|
2017 |
$1.90 billion (Surplus) |
|
2018 |
$6.82 billion (Surplus) |
|
2019 |
$11.16 billion (Surplus) |
|
2020 |
$20.13 billion (Surplus) |
|
2021 |
$5.04 billion (Surplus) |
|
2022 |
$12.12 billion (Surplus) |
|
2023 |
$27.63 billion (Surplus) |
|
2024 |
$24.11 billion (Surplus) |
|
2025 |
$20.03 billion (Surplus) |
Monthly Trade Developments in Early 2026
Trade dynamics & Vietnam shipment data during the first two months of the year illustrate how the deficit developed.
January 2026
-
Trade deficit: approximately $1.78 billion
February 2026
-
Trade deficit: $1.04 billion
-
Exports: $33.06 billion
-
Imports: $34.1 billion
Exports grew 5.7% year-on-year, while imports rose 4.4%, narrowing the monthly deficit slightly. This suggests that the trade deficit could be temporary rather than structural.
Vietnam’s Historical Trade Balance Evolution
To understand the significance of the 2026 deficit, it is important to review Vietnam’s long-term trade trajectory.
1. The Deficit Era (2001–2011)
During the early 2000s, Vietnam ran persistent trade deficits as its economy industrialized.
Trade balance trend
|
Year |
Trade Balance |
|
2001 |
–$1.2B |
|
2005 |
–$4.5B |
|
2007 |
–$14.1B |
|
2008 |
–$18B |
The 2008 deficit of $18 billion remains the largest in Vietnam’s history. This period was characterized by:
-
Rapid industrialization
-
Heavy imports of machinery and capital goods
-
Limited domestic manufacturing capacity
2. Transition to Surplus (2012–2016)
Vietnam achieved its first trade surplus in 2012, marking a turning point in its trade structure. Key developments included:
-
Expansion of electronics manufacturing
-
Rapid growth of export-oriented foreign investment
-
Integration into global supply chains
Trade balance
|
Year |
Balance |
|
2012 |
+$0.78B |
|
2013 |
+$0.86B |
|
2014 |
+$2.14B |
|
2016 |
+$2.68B |
This shift was driven largely by multinational manufacturing investment.
3. Export Boom Era (2017–2024)
Vietnam’s trade surplus expanded significantly during the late 2010s and early 2020s.
Trade balance highlights
|
Year |
Surplus |
|
2017 |
$2.92B |
|
2018 |
$6.8B |
|
2019 |
$11.12B |
|
2020 |
$19.95B |
|
2024 |
$24.77B |
The growth reflects Vietnam’s rising role as a global manufacturing hub, particularly as supply chains diversified away from China. By 2024, Vietnam’s trade surplus reached nearly $25 billion, indicating strong export competitiveness.
Drivers Behind Vietnam’s Trade Deficit in Early-2026
Several structural and cyclical factors contributed to the early-2026 deficit.
1. Import Surge for Industrial Production
Vietnam imports large quantities of:
-
Electronics components
-
Machinery
-
Raw materials
When manufacturing output accelerates, imports often rise before exports catch up. In early 2026, imports increased 26.3% year-on-year, outpacing export growth.
2. Foreign Investment-Led Manufacturing
Vietnam’s export sector is heavily dependent on foreign companies.
-
Foreign-invested firms generate around 79% of exports.
-
Domestic firms often rely on imported inputs.
This structure creates a structural trade imbalance within the domestic sector.
3. Global Energy and Commodity Volatility
Energy price fluctuations can also impact trade balances. Recent geopolitical tensions affecting global energy supply have pushed fuel prices higher, influencing Vietnam’s import bill. Since Vietnam still imports significant amounts of energy products, rising prices increase the trade deficit.
4. Supply Chain Adjustments
Vietnam continues to benefit from supply chain diversification, but shifts in production cycles can temporarily affect trade balances.
For example:
-
Companies may import components ahead of production runs.
-
Export shipments may occur in later months.
This can produce short-term deficits even when annual trade remains positive.
Vietnam’s Major Trading Partners
Vietnam’s trade relationships are concentrated among several key economies.
Major export destinations
-
United States
-
China
-
European Union
-
South Korea
-
Japan
The United States is particularly significant. In 2025, U.S. imports from Vietnam reached $193.8 billion, generating a $178.2 billion U.S. trade deficit with Vietnam. This makes Vietnam one of the largest exporters to the U.S. market, as per the data on Vietnam exports to the US.
Vietnam’s Strategic Trade Strengths
Despite temporary deficits, Vietnam maintains several long-term competitive advantages.
1. Manufacturing competitiveness
Vietnam offers:
-
Competitive labor costs
-
Strong export infrastructure
-
Extensive free trade agreements
These factors attract multinational manufacturers.
2. Strategic geographic position
Vietnam sits at the center of Asia’s manufacturing networks, as per the Asia trade data. Key advantages include:
-
Proximity to China’s supply chains
-
Access to ASEAN markets
-
Strong maritime trade
3. Expanding trade agreements
Vietnam participates in several major trade agreements, including:
-
CPTPP
-
EU-Vietnam Free Trade Agreement
-
Regional Comprehensive Economic Partnership (RCEP)
These agreements provide tariff advantages and market access.
Forecast: Vietnam Trade Balance Outlook (2026–2030)
Most economic forecasts expect Vietnam to maintain a long-term trade surplus, despite occasional monthly deficits.
Short-Term Outlook (2026)
Economists expect Vietnam’s trade balance to improve later in 2026 due to:
-
Seasonal export growth
-
Electronics production cycles
-
Increased shipments to the U.S. and EU
Monthly deficits early in the year are common in export-driven economies.
Medium-Term Outlook (2027–2030)
Several trends will shape Vietnam’s trade trajectory. Expected drivers of export growth include:
-
Electronics manufacturing expansion
-
Semiconductor supply chain relocation
-
Electric vehicle components production
-
Digital technology exports
Vietnam’s export sector is likely to continue growing at double-digit rates.
Potential risks
However, several risks could affect the trade balance.
1. Supply chain concentration
Heavy reliance on imported components may continue to create periodic deficits.
2. Energy import dependence
Energy imports remain a structural vulnerability.
3. Global economic slowdown
Weak global demand could reduce exports.
4. Trade tensions
Trade imbalances with major partners could lead to tariff pressures.
Structural Reforms Needed to Reduce Trade Deficits
Vietnam has several policy options to strengthen its trade position.
1. Strengthening domestic supply chains
Encouraging local production of:
-
Electronic components
-
Industrial machinery
-
Raw materials
This would reduce reliance on imports.
2. Supporting domestic exporters
Policies that support local firms include:
-
Export financing
-
Trade modernization
-
Technology adoption
3. Energy diversification
Reducing fossil fuel imports through:
-
renewable energy expansion
-
LNG infrastructure
-
domestic energy production
Long-Term Trade Balance Trends
Vietnam’s trade balance historically fluctuates between deficits and surpluses depending on the stage of economic development.
Key long-term indicators:
-
Average trade balance since 1986: –4.18% of GDP
-
Record deficit: –13.64% of GDP in 2008
-
Recent peak surplus: 8.12% of GDP in 2023
These figures show that Vietnam’s trade balance can shift significantly during periods of rapid economic change.
Conclusion and Final Thoughts
Vietnam’s $2.98 billion trade deficit in the first two months of 2026 is best understood as a short-term imbalance within a rapidly expanding trade system. Despite the deficit, several structural indicators remain positive:
-
Trade volume grew 22.2% year-on-year
-
Export-oriented manufacturing continues to expand
-
Foreign-invested firms maintain strong export surpluses
Historically, Vietnam transitioned from persistent deficits in the early 2000s to sustained surpluses in the past decade. The current deficit appears to be a cyclical result of rising imports for industrial production rather than a structural deterioration. Looking ahead, Vietnam’s trade outlook remains strong. With growing participation in global supply chains, expanding trade agreements, and increasing foreign investment, the country is likely to continue strengthening its role as a major export powerhouse.
However, the early-2026 deficit also highlights a key policy challenge: reducing dependence on imported production inputs while strengthening domestic industrial capacity. If Vietnam successfully addresses these structural issues, it could maintain long-term trade surpluses while sustaining rapid economic growth through the rest of the decade.
Note For Our Readers
We hope you found this data-driven analysis of Vietnam’s $2.98 billion trade deficit in early 2026, along with its historical trade patterns and future outlook, useful and informative. Examining trade balance trends through real import-export data helps businesses, economists, and global trade professionals understand how shifts in manufacturing demand, supply chains, and international markets shape a country’s economic trajectory.
Looking to explore Vietnam’s trade flows in more detail or track sector-specific import and export movements? Access the latest Vietnam export-import statistics or search live Vietnam trade data by HS code, product, country, or port activity by visiting VietnamExportdata. For customized trade reports, verified Vietnamese exporter and importer databases, buyer details, or deeper market intelligence, contact us at info@tradeimex.in today.
Share
What's Your Reaction?
 Like
0
Like
0
 Dislike
0
Dislike
0
 Love
0
Love
0
 Funny
0
Funny
0
 Angry
0
Angry
0
 Sad
0
Sad
0
 Wow
0
Wow
0